
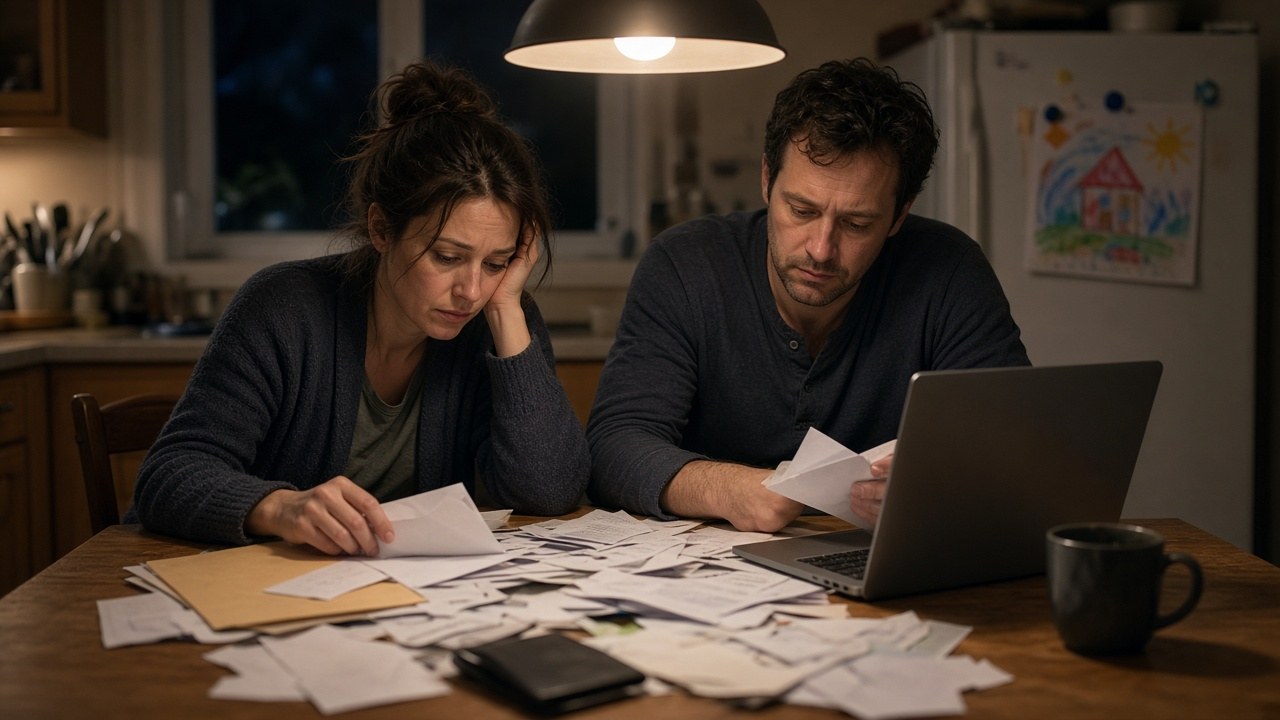
Key takeaway: The middle class is not saving less because it suddenly forgot how. Fixed bills for housing, health coverage, childcare and transportation now take about three quarters of a typical middle household's spending, and frictionless checkout, buy now pay later and forgotten subscriptions drain much of the rest. The fix is less about willpower and more about where you put the friction.
Why can't the middle class save money? Because most of a middle income is committed to rent or a mortgage, insurance premiums, childcare and a car before payday, and the small remainder is exposed to spending designed to happen without a decision.
That is the short answer. The longer one matters, because the usual explanation, that people in the middle lack discipline, gets the order of events backwards. The money is not being wasted at the end of the month. It is gone at the beginning.
Picture a household in the exact middle of the American income ladder. Two adults, a child, one car payment, a lease that renews every spring. Nobody in that home is buying a boat. They still check the balance on the 24th with the expression usually reserved for a dentist's estimate.
I think that expression deserves a better explanation than "stop buying coffee." So here is what the numbers say, where my own argument gets too comfortable, and what I would actually change.
The paycheck that arrives already spent
The cleanest picture comes from the Bureau of Labor Statistics Consumer Expenditure Survey. In 2024 the middle fifth of US households, with incomes starting at about $57,500 and ending near $94,500, averaged $74,474 in income before taxes and $66,900 in spending.¹
Look at where the $66,900 went. Housing took $24,093. Transportation took $11,657. Healthcare took $5,676 and food took $9,097. Those four lines add up to $50,523, roughly 75 cents of every dollar spent, and none of them is the kind of expense you cancel after a stern conversation with yourself.¹
The gap between that income and that spending is about $7,600 a year. It sounds like room to save until you remember the spending figure does not include federal and state income taxes. Those come out of the same gap. What remains at the end of an ordinary year is closer to a rounding error than a cushion.
This is the part the willpower lectures skip. When three quarters of spending is housing, transport, health and food, the space where discipline can work is small. You can be careful with it. You cannot be careful enough to turn it into a down payment.

Four bills that do not care about your willpower
Start with housing. Harvard's Joint Center for Housing Studies counted a record 22.7 million renter households spending more than 30 percent of income on housing in 2024. Among middle income renters earning $45,000 to $74,999, 49 percent were cost burdened, up 9.5 percentage points since 2019. Renters' median housing costs rose 38 percent over those five years while their incomes rose 28 percent.²
Health coverage is the quieter one, because it leaves before the paycheck does. KFF's 2026 survey of employer plans put the average family premium at $28,303. Workers paid $7,471 of it themselves, up 9 percent in one year, while wages rose 3.7 percent.³ A raise that size does not keep up with your own insurance deduction.
Then childcare. Child Care Aware of America put the national average price at $13,184 a year in 2025, and center care for an infant runs higher.⁴ For a family with a toddler, that is a second rent payment that happens to come with finger paint.
And the car. AAA estimates that owning and running a new vehicle now costs $12,863 a year once depreciation, financing, fuel, insurance and maintenance are counted.⁵ Kelley Blue Book put the average new vehicle transaction price at $50,562 in September 2026, a hair below its record.⁶ In most of the country, a car is not a lifestyle choice. It is how you get to the job that pays for the car.
None of these four bills accepts "I skipped a latte" as payment.
What the 4.1 percent is hiding
The headline number is the personal saving rate from the Bureau of Economic Analysis. It was 4.1 percent in August 2026.⁷ It averaged 7.3 percent in 2019 and about 10 percent from 1960 through 1999, by my own calculation from the same monthly series. That is a real decline, and it is the figure that gets quoted when someone wants to call Americans reckless.
The trouble is that it is an aggregate. It adds every household together, so it cannot tell you whether the money is being saved in the middle, at the top, or nowhere. For the middle, a better window is the Federal Reserve's annual survey of household finances.
In the Fed's latest survey, fielded in October 2025, 63 percent of adults said they would cover a $400 emergency with cash or its equivalent, down from 68 percent in 2021. Only 55 percent had emergency savings that would last three months, down from 59 percent. And just 35 percent of adults who are not retired thought their retirement savings were on track.⁸
By income, the split is telling. Among adults earning $50,000 to $99,999, 55 percent had a three month cushion, compared with 75 percent of those earning $100,000 or more and 21 percent of those under $25,000.⁸ The middle is not broke. It is simply one bad quarter away from finding out how close it was.
Spending without friction, saving with paperwork
Here is where I think the design of modern money deserves more blame than it gets. Spending has been engineered to take one tap. Saving still asks you to log into a different app, move money on purpose and resist a notification while doing it. One of those flows had a product team. The other one had a compliance team.
Buy now pay later is the clearest case. The Consumer Financial Protection Bureau found that 21.2 percent of consumers with a credit record used these loans in 2022, up from 17.6 percent a year earlier. About a fifth of borrowers took out more than one a month, 63 percent held several at once, and their credit card use had already been climbing before they started.⁹
That last detail matters. Pay in four is often not replacing savings. It is filling a gap that savings were supposed to fill, which means the loan shows up exactly when the cushion is missing. Four small payments also feel lighter than one big one, which is the whole pitch.
Subscriptions work the same way in slow motion. In a 2022 survey of 1,000 US consumers by C+R Research, people guessed they spent $86 a month on subscriptions. When they listed them, the real figure averaged $219. Forty two percent said they had kept paying for a service they had stopped using.¹⁰ Automatic renewal is not a crime. It is just a business model built on your memory being worse than the billing system's.
Recommendation engines, saved cards and personalized offers sit on top of all this. I am not claiming any single feature is sinister. My point is that the combined effect is a system that removes every pause before spending, while the pause before saving stays exactly where it was.

Money worry clocks in after midnight
The sleep thread is not decoration here. Money stress takes sleep, and the evidence is consistent. In a German study comparing 538 over indebted adults with a national health survey, debt was linked to higher odds of trouble falling asleep (adjusted odds ratio 1.79), trouble staying asleep (1.45) and sleep medication use (3.94), after accounting for income, education and mental illness.¹¹
Lost sleep then changes how you treat money. In a Duke and Duke NUS study, a single night of sleep deprivation shifted volunteers from protecting against losses toward chasing gains, with matching changes in brain areas that weigh reward and risk.¹² A tired brain is not lazier with money. It is more optimistic, which is worse.
Real shopping data points the same way. Researchers analyzing 1,625,472 purchases from a large Chinese online retailer found that items bought between midnight and 6 a.m. were more likely to be returned, a sign of regret, with a hazard ratio of about 1.21.¹³ The store never closes, and your judgment does.
Put those together and you get a loop. A thin cushion makes you anxious, anxiety cuts sleep, short sleep nudges you toward riskier, more hopeful spending, and the phone in your hand at 1 a.m. is the most frictionless store ever built. We wrote about the 3 a.m. version of that loop at https://thinknarratives.com/articles/waking-up-at-3-am-is-not-the-problem-the-clock-on-your-nightstand-is.
Where the "cannot save" story stops being true
I should push back on my own headline, because "the middle class cannot save" is not quite right either. The same BLS table shows the middle fifth putting $5,813 a year into pensions, retirement plans and Social Security, and paying another $1,937 in mortgage principal.¹ That is saving. It is simply locked inside a payroll deduction and a house, where you cannot use it for a broken transmission.
The middle is also wide. Pew Research Center defines middle income as two thirds to double the national median, adjusted for household size, which for a three person household meant roughly $61,000 to $183,000 in its 2024 analysis.¹⁴ A family at the top of that range has choices a family at the bottom does not, and pretending otherwise flatters everyone.
Choices still count. Entertainment, restaurants and a car that is nicer than it needs to be are real line items, and lifestyle creep is real. We went into the identity side of middle class spending at https://thinknarratives.com/articles/middle-class-is-the-worst-too-rich-to-be-poor-too-poor-to-be-rich. My argument is about proportion, not innocence. Small choices matter at the margin, and the margin got smaller.
Pew also found the share of Americans living in middle income households fell from 61 percent in 1971 to 51 percent in 2023.¹⁴ Some of that is people moving up. The rest is the middle getting both thinner and more crowded at the bottom edge, which is exactly where savings go to die.
Putting friction back where it belongs
If the problem is that spending got easy and saving stayed hard, the useful fixes reverse that. None of them is glamorous, and none of them will fix your rent. They just stop the remainder from leaking.
First, make saving happen on payday without a decision, the same way retirement contributions already do. The household survey above found that 86 percent of adults who always had money left at the end of the month had three months of savings, against 13 percent of those who never did.⁸ Moving the money first is how you manufacture the leftover.
Second, add friction on purpose. Delete saved cards from the shopping apps you use most, turn off one tap checkout, and set a rule of one buy now pay later loan at a time. Once a year, read every recurring charge on your bank statement instead of trusting your memory, since memory apparently undercounts by about $133 a month.¹⁰
Third, protect the night. Do not buy anything that is not urgent after midnight, and if money worry is what keeps you awake, write down the actual number before bed so your brain has less to rehearse. If the big fixed costs are the real issue, that is a housing and career question, and we wrote about the price of the "good life" at https://thinknarratives.com/articles/the-good-life-got-too-expensive.
The cushion stays thin until rent and premiums slow down
Next Thursday, October 29, the government publishes both the September saving rate and the 2025 Consumer Expenditure Survey. I do not expect either to change the story. The saving rate will stay well below its 1990s levels for years, because the bills that crowd it out are not cyclical.
Health premiums will keep outrunning wages unless employers shift more workers into plans with higher deductibles, which moves the cost rather than reducing it. Buy now pay later will keep growing and will look more like ordinary credit as it gets reported and regulated. Apps will not add friction to checkout voluntarily.
What could change is the default. If more employers offer automatic emergency savings next to the retirement plan, the middle will save more without becoming more virtuous. That is the honest lesson in the data. The middle class does not need a lecture. It needs the saving button to be as easy to press as the buy button.
FAQ
Why can't the middle class save money? Mostly because housing, health insurance, childcare and transportation take the large majority of a middle income before discretionary spending starts. In 2024 the middle fifth of US households spent about 75 percent of their budget on housing, transport, healthcare and food. Easy credit and automatic subscriptions then absorb much of what is left.
What percentage of Americans could cover a $400 emergency expense? In the Federal Reserve's survey fielded in October 2025, 63 percent of adults said they would cover a $400 expense with cash or its equivalent. That was unchanged from the year before and down from 68 percent in 2021. Twelve percent said they could not pay it by any means.
How much should a middle class family have in savings? A common target is three months of expenses in an emergency fund, which is also the threshold the Federal Reserve measures. In its latest survey, 55 percent of adults earning $50,000 to $99,999 met it. Retirement savings are separate, and only 35 percent of adults not yet retired said theirs were on track.
Does buy now pay later hurt your savings? Not automatically, but it often shows up where savings are missing. The CFPB found that BNPL borrowers frequently hold several loans at once and that their credit card use tends to rise before their first BNPL loan. Using it to cover routine expenses is a sign the emergency cushion is too thin.
Can money stress cause insomnia? It is strongly linked to it. A German study found over indebted adults had higher odds of trouble falling asleep and staying asleep and nearly four times the odds of using sleep medication, after adjusting for income and mental illness. Poor sleep, in turn, can push people toward riskier financial choices.
This article is for general information and is not financial or medical advice. If debt or money worry is affecting your sleep or health, consider talking to a nonprofit credit counselor or a qualified clinician.
Sources
¹ US Bureau of Labor Statistics, "Consumer Expenditure Surveys, Table 1101: Quintiles of income before taxes, 2024." Middle quintile income, spending by category, retirement and pension contributions, and mortgage principal paid. https://www.bls.gov/cex/tables/calendar-year/mean-item-share-average-standard-error/cu-income-quintiles-before-taxes-2024.xlsx
² Joint Center for Housing Studies of Harvard University, "The State of the Nation's Housing 2026." Record renter cost burdens in 2024, middle income renter burdens and the 2019 to 2024 gap between housing costs and incomes. https://www.jchs.harvard.edu/sites/default/files/reports/files/Harvard_JCHS_The_State_of_the_Nations_Housing_2026_0.pdf
³ KFF, "2026 Employer Health Benefits Survey," October 2026. Average family premium, worker contribution and wage growth. https://www.kff.org/health-costs/2026-employer-health-benefits-survey/
⁴ Child Care Aware of America, "Price and Supply 2025," child care price data. National average child care price of $13,184. https://info.childcareaware.org/price-and-supply-2025
⁵ AAA, "New Vehicle Ownership Costs Hit $12,863 Annually," Your Driving Costs, September 15, 2026. https://newsroom.aaa.com/2026/09/aaa-new-vehicle-ownership-costs-hit-12863-annually/
⁶ Kelley Blue Book and Cox Automotive, "Average New Vehicle Transaction Prices Flirt with All-Time High," October 13, 2026. September 2026 average transaction price of $50,562. https://mediaroom.kbb.com/2026-10-13-Kelley-Blue-Book-Report-Average-New-Vehicle-Transaction-Prices-Flirt-with-All-Time-High,-Despite-Trend-Toward-More-Affordable-Product
⁷ US Bureau of Economic Analysis, "Personal Saving Rate (PSAVERT)," via Federal Reserve Bank of St. Louis FRED. August 2026 value and historical monthly series used for the 2019 and 1960 to 1999 averages. https://fred.stlouisfed.org/series/PSAVERT
⁸ Board of Governors of the Federal Reserve System, "Economic Well-Being of U.S. Households in 2025: Savings and Investments," May 2026. $400 expense, three month emergency savings by income, month end leftovers and retirement readiness. https://www.federalreserve.gov/publications/2026-economic-well-being-of-us-households-in-2025-savings-investments.htm
⁹ Consumer Financial Protection Bureau, "Consumer Use of Buy Now, Pay Later and Other Unsecured Debt," January 2025. BNPL use in 2022, stacking and prior credit card use. https://files.consumerfinance.gov/f/documents/cfpb_BNPL_Report_2025_01.pdf
¹⁰ C+R Research, "Subscription Service Statistics and Costs," 2022 survey of 1,000 US consumers. Estimated versus actual monthly subscription spending and unused subscriptions. https://www.crresearch.com/blog/subscription-service-statistics-and-costs/
¹¹ Jacqueline Warth, Marie-Therese Puth, Judith Tillmann, Johannes Porz, Ulrike Zier, Klaus Weckbecker and Eva Münster, "Over-indebtedness and its association with sleep and sleep medication use," BMC Public Health 19, 957, 2019. 538 over indebted adults compared with 7,447 adults from a national survey. https://doi.org/10.1186/s12889-019-7231-1
¹² Vinod Venkatraman, Scott A. Huettel, Lisa Y. M. Chuah, John W. Payne and Michael W. L. Chee, "Sleep Deprivation Biases the Neural Mechanisms Underlying Economic Preferences," Journal of Neuroscience 31(10), 3712 to 3718, 2011. One night without sleep shifted choices from loss avoidance toward gain seeking. https://doi.org/10.1523/JNEUROSCI.4407-10.2011
¹³ Shiyang Gong, Yibo Zhang and Yuetao Gao, "Sleep deprivation and post-purchase regret: Evidence from a large-scale individual-level data," Acta Psychologica Sinica 55(2), 286, 2023. 1,625,472 purchases; items bought from midnight to 6 a.m. more likely to be returned. https://doi.org/10.3724/SP.J.1041.2023.00286
¹⁴ Pew Research Center, "The State of the American Middle Class," May 31, 2024. Definition of middle income, three person income range and the share of Americans in middle income households, 1971 to 2023. https://www.pewresearch.org/race-and-ethnicity/2024/05/31/the-state-of-the-american-middle-class/